Market Context
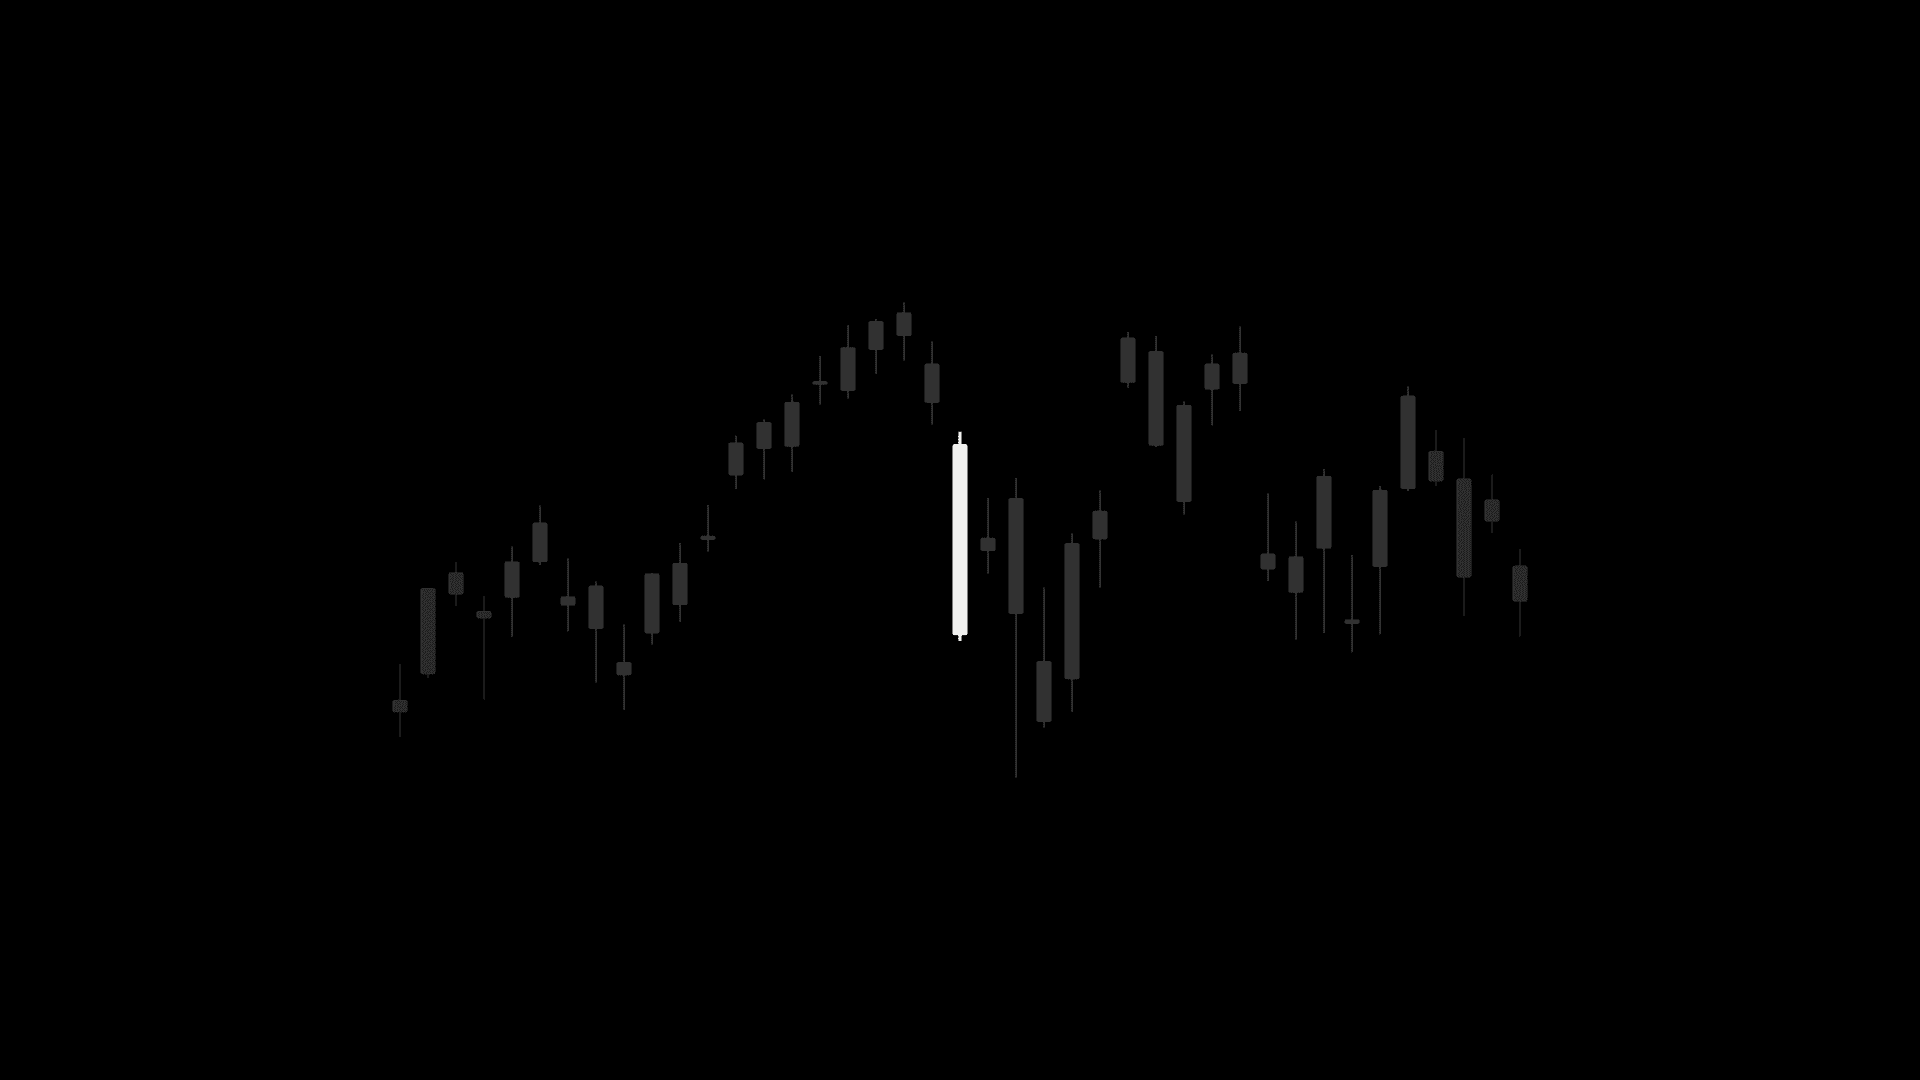
A heavy QQQ selloff that separates the easier market before it from the choppier market after it.
Nick SchmidtPublishedUpdated
In this concept
This is a study of two broad selloffs that stopped a clean uptrend and separated the easier market before from the choppier market after. They happened across the market, not just in QQQ, but I use QQQ to measure the before and after.
A trend-stopping candle is a heavy selloff that ends the clean uptrend and changes the market from easy to choppy. That is what I saw after October 10 and June 5 on QQQ. Both came after long uptrends, and the market after each candle became wider, more back-and-forth, and much harder to trade. One candle does not tell me the market is about to crash or that the final top is in. It tells me the easy market that came before it is no longer intact.
The daily view shows the change around the candle. QQQ is in a clean uptrend on the left, the heavy selloff becomes the dividing line, and the action on the right gets wider and much less directional. The weekly view pulls it back further. October especially shows how long the trend ran before the candle and how the chop continued for months after the 27-session study ended.
Before
Uptrend
Oct 10
-3.5% day
After
-1.2% net
Before
Uptrend
Jun 5
-4.8% day
After
-3.1% net
QQQ trend-stopping candle comparison
| Characteristic | October 10 | June 5 |
|---|---|---|
| QQQ decline | -3.5% | -4.8% |
| Sessions since prior 3% decline | 122 | 163 |
| Range vs prior 40-session average | 4.5x | 3.1x |
| Volume vs prior 40-session average | 1.9x | 2.5x |
October 10 was the first 3% decline in 122 sessions. June 5 was the first in 163. In both cases, QQQ had gone more than 100 sessions without a comparable day of selling. Then the decline arrived with an expanded range, heavy volume, and a close practically at the low.
Comparing the next 27 sessions showed how wide the days became, how often direction reversed, and whether QQQ actually went anywhere.
QQQ behavior around each trend-stopping candle
| Measure | October 10 | June 5 |
|---|---|---|
| Daily range after, excluding candle | +51% | +56% |
| Sessions with 1%+ gaps before candle | 0% | 15% |
| Sessions with 1%+ gaps after candle | 31% | 42% |
| Sessions reversing prior direction | 16 of 26 | 16 of 26 |
For both examples, I used a 27-session window beginning with the event candle. The range comparison excludes that candle and measures the following 26 sessions against the prior 40. The gap rates compare the prior 27 sessions with the following 26, excluding the event candle.
After the liquidation candles, the average daily range widened 51% following October 10 and 56% following June 5. That is what made the change so difficult. The market stopped trending, but each day became much wider anyway. Direction reversed on 16 of the next 26 sessions in both samples, and QQQ finished those periods 1.2% and 3.1% lower. There was more movement to sit through without a trend paying for it.
The big overnight gaps made it harder too. During the uptrend before October 10, none of the sessions opened 1% or more away from the prior close. After the candle, 31% did. Before June 5, 15% of sessions had a 1% gap. After it, that jumped to 42%. A lot more movement was happening before the session even opened.
This period also showed up clearly in my feedback loop. It became harder to make progress in individual stocks because the market was no longer carrying even the cleanest setups, and the feedback from my trades kept getting worse. That naturally had me reducing exposure, sizing smaller, or not trading at all.
June 5 does not tell me another March correction has to happen, and October 10 did not mark the final top either. QQQ recovered, made a new high later that month, and did not reach a 10% correction until March. The useful change came earlier. After that candle, the easy trend was gone and the next several months were wider and less directional.
Two examples do not make a complete system, and I do not know whether the current environment will end the way the last one did. The claim is narrower. In both cases, one unusually heavy candle stopped the easy uptrend and separated the market before it from the chop that followed.
Want to know when something new is published?
| Candle body as % of range |
| 91% |
| 91% |
| Close within day's range | Bottom 2% | Bottom 3% |
| Net change | -1.2% | -3.1% |